


Description
Cypress provides a testing framework for the Java programming language. The Cypress plug-in imports the test results data in HCL DevOps Velocity metrics.
Cypress provides a testing framework for the Java programming language. The Cypress plug-in imports the test results data in HCL DevOps Velocity metrics.
You can now easily explore the functional test results in HCL DevOps Velocity with charts on the Insights page. Filter by applications, value streams, or teams to instantly identify performance trends and make data-driven decisions across the organization.
Cypress plug-in helps in visualizing the functional test results in intuitive graphs, enabling rapid feedback, trend analysis, and informed decision-making for development teams.
To use the Cypress plug-in, the plug-in must be loaded, and an instance created. Load the plug-in into the HCL DevOps Velocity container if necessary.
The Cypress plug-in is a parser type plug-in. It parses XML and JSON data.
1. In HCL DevOps Velocity, click Settings > Integrations > Available.
2. In the Action column for the Cypress plug-in, click Install.
The plug-in is now listed in the Installed tab and available for invoking.
To gather data from the Cypress server, you must send an HTTP Post request with the data to parse. Whenever there is a hit to the endpoint, the data is parsed and displayed as metrics in HCL DevOps Velocity. You can use various methods such as Postman, REST calls, CURL to invoke the plug-in endpoints.
When using a REST call to invoke the Cypress plug-in, it must be a POST method and include the location of the HCL DevOps Velocity quality data endpoint.
The following request sample shows a REST call that you can copy and update as necessary.
Key points about the snippet:
The URL points to the HCL DevOps Velocity quality data endpoint. Update with the server location for your installation of HCL DevOps Velocity. The BODY of the call is multipart/form data. It includes information about the payload.
METHOD: POST
URL: https://url_devopsvelocity_server/reporting-consumer/metrics
BODY (multipart/form-data):
 {
  payload: "payload_json_object_string" // See below for schema format
  testArtifact: "xml_file/JSON_file"
 }
curl --request POST \
  --url https://url_devopsvelocity_server/reporting-consumer/metrics \
  --form 'payload={
  "tenant_id": "",
  "application": {
    "name": "My Application"
  },
  "record": {
     "pluginType": "cypress",
     "dataFormat": "XML", // for xml use XML and for json use JSON
     “metricDefinitionId”: “Functional Tests” // Optional: If metricDefinitionId is blank then by default graph will display under Unit Tests.
  }
}
' \
  --form testArtifact=@test-result/cypress.xml
The following shows the schema for the payload. Replace values for the parameters with the actual values.
{
  "tenant_id": "tenant_id",    // required Tenant ID
  "metricName": "metric_name", // optional: name for recurring test set
  "application": {
    "name": "application_name"  //Name of application
  },
  "record": {
    “metricDefinitionId”: “Functional Tests” // Optional: If metricDefinitionId is blank then by default graph will display under Unit Tests.
    "recordName": "record_name", // optional: Name for this record
    "executionDate": 1547983466015, // optional: UNIX Epoch
    "pluginType": "cypress",
    "dataFormat": "XML/JSON",
    "metricsRecordUrl": "Jenkins_build_url" // optional: To link the Jenkins build with test results
  },
  "build": {  // Optional: One of the following fields must be included
    "buildId": "build_id",
    "jobExternalId": "external_job_id",
    "url": "build_url",
  },
  "commitId": "commit_id",  // optional
  "pullRequestId": "pullrequest_id", // optional
  "environment": "environment_name" // optional
}

Once you invoke the plug-in, perform the following steps to add the chart for unit test in HCL DevOps Velocity.
1. In HCL DevOps Velocity, click Insights > All Dashboards.

2. Open any existing dashboard or create a new dashboard and open.
3. Click Add charts.
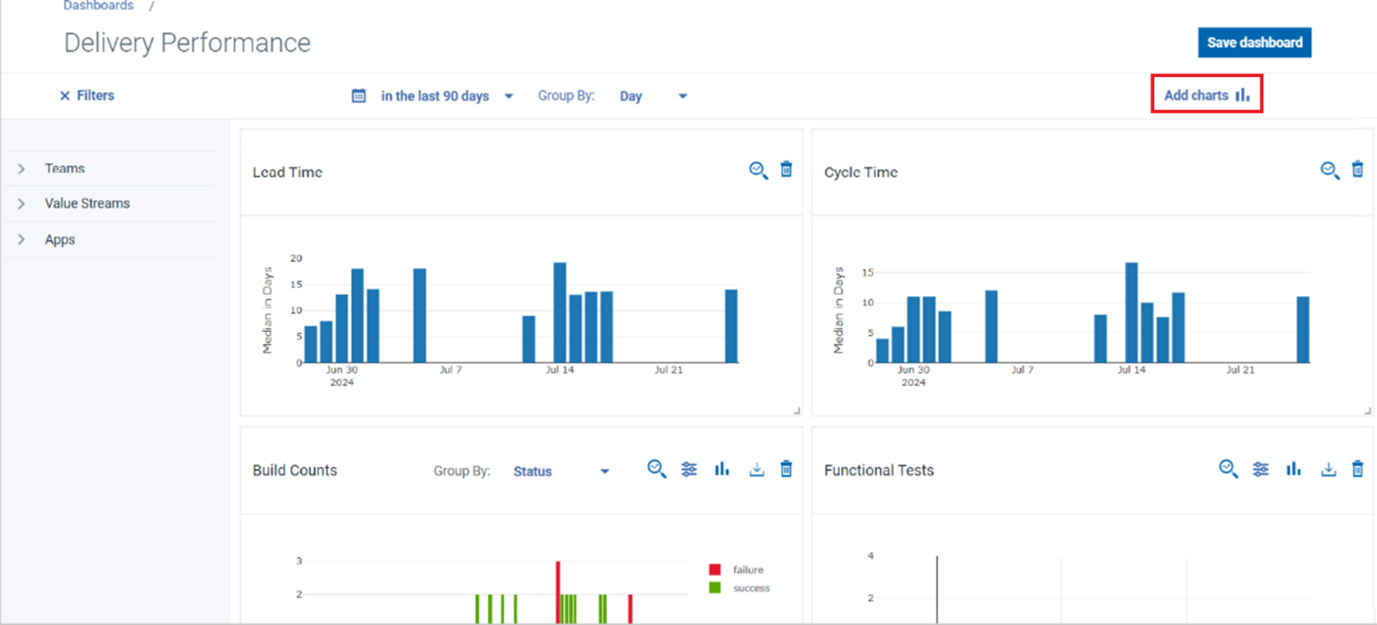
4. Under the Quality category, add Functional Tests charts.

5. You can see the functional test chart added to the dashboard. Analyze the data in the functional test chart to view the functional test results.

 Summary
 Usage
Usage